
TL;DR
- MITRE Coverage answers “are we covered?” with a heatmap fed by live telemetry and live detection state. No spreadsheet, no quarterly briefing, no piecing it together from four tools.
- Every uncovered technique sorts into one of two buckets: deploy a detection today (actionable gap) or onboard data first (blind spot). The next move is always concrete.
- Inactive library detections show their historical match counts, so you know whether enabling will be quiet or noisy before you commit.
Why is MITRE ATT&CK coverage so hard to actually answer?
The data exists. The answer wasn’t.
Ask most detection teams how covered they are against credential access, and they’ll give you a number they’re not fully confident in.
Not because the data doesn’t exist. It does. But it’s scattered. Telemetry, detections, and mappings all live in different places, so teams end up reconstructing coverage manually every time they need an answer.
That makes prioritization harder than it should be. Engineers don’t know where to focus. Leaders don’t get a clear picture without a full briefing.
Coverage that has to be rebuilt on demand isn’t real visibility. It’s ongoing overhead.
What does coverage-driven detection engineering look like in a real day?
Instead of guessing priorities, engineers open MITRE Coverage and immediately see where they can act.
New data source? Newly actionable techniques appear.
From there, each gap leads to a clear next step:
- Enable an existing detection (with known noise risk)
- Generate a new one tailored to your environment
- Or defer consciously
In one short session, gaps get closed, priorities are clear, and posture can be shared instantly. No slides required.
How does Vega’s MITRE Coverage view work?
You’ll find MITRE Coverage in Vega under Assessment → MITRE Coverage.
1. See your full posture at a glance
The heatmap is the whole ATT&CK framework. Every tactic from Reconnaissance to Impact, every technique color-coded by your real coverage state right now.
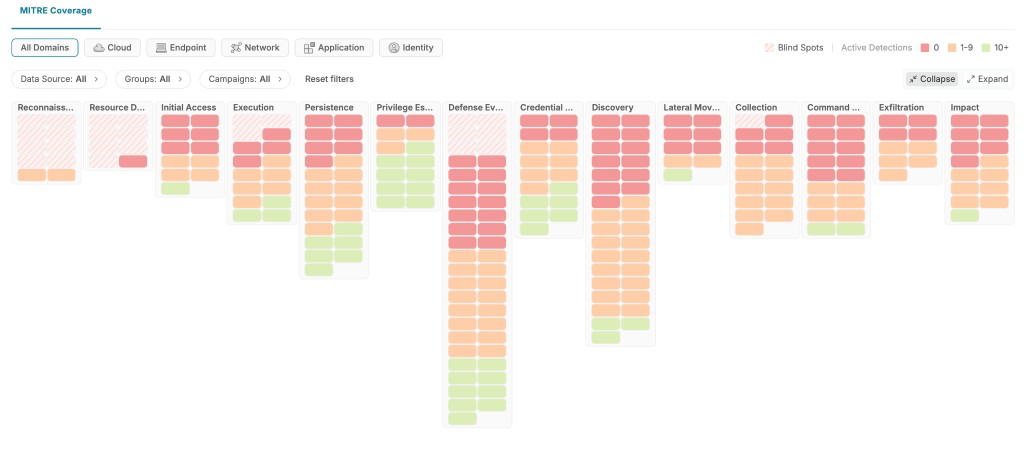
Coverage state is derived from two signals Vega evaluates continuously for every technique and sub-technique:
- Telemetry reality. Is the required data actually being ingested?
- Detection reality. Is a detection active, or deployable against that data?
Techniques automatically sort by state within each tactic, so the weakest spots surface immediately. Active detections include library detections, custom detections your team has built, and external detections mapped automatically by Vega AI from connected legacy SIEMs.
2. Focus on what matters to you
The default heatmap reflects your full environment - every domain, every data source. But coverage looks different depending on where you’re focused.
Use the Domain filter to shift the view to a specific security domain: Cloud, Endpoint, Identity, Application, or Network. The heatmap responds immediately. Techniques irrelevant to the selected domain drop away, detection counts recalculate, and coverage colors update to reflect only what’s applicable. A technique that looks well-covered across all domains may reveal real gaps when scoped to Endpoint alone.
You can also filter by threat actor or campaign to scope the map to adversaries relevant to your environment or industry, turning the heatmap into a targeted readiness check against the threats you actually care about.
3. Expand a tactic to find your starting point
Click any tactic and the techniques fall open underneath. Each row shows the name, the coverage color, how many detections are active on it, and an opportunities bar with what’s still on the table - including inactive library detections ready to deploy.
Techniques with telemetry already connected but no active detections are your highest-value targets. The data is there. You just need the detection.
4. Drill into a specific technique
Click any technique and a side panel opens. The Overview tab shows what’s running on it: connected data sources, sub-techniques mapped under the technique, and every active detection currently covering it (library, custom, or external) grouped by sub-technique.
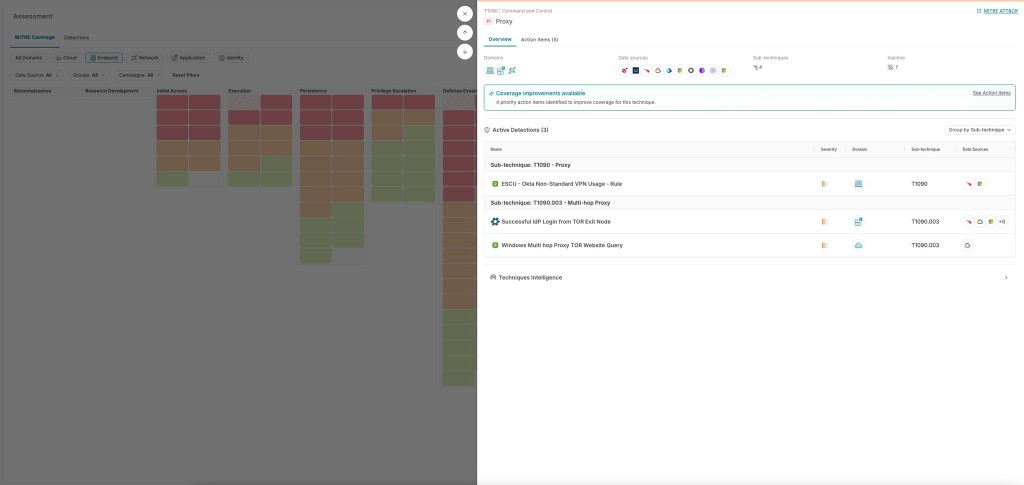
Each technique also carries a priority level based on likelihood of exploitation, impact, and feasibility, so you have a signal on which gaps carry the most weight.
5. Take action from the Action Items tab
Switch to Action Items to see your concrete next moves.
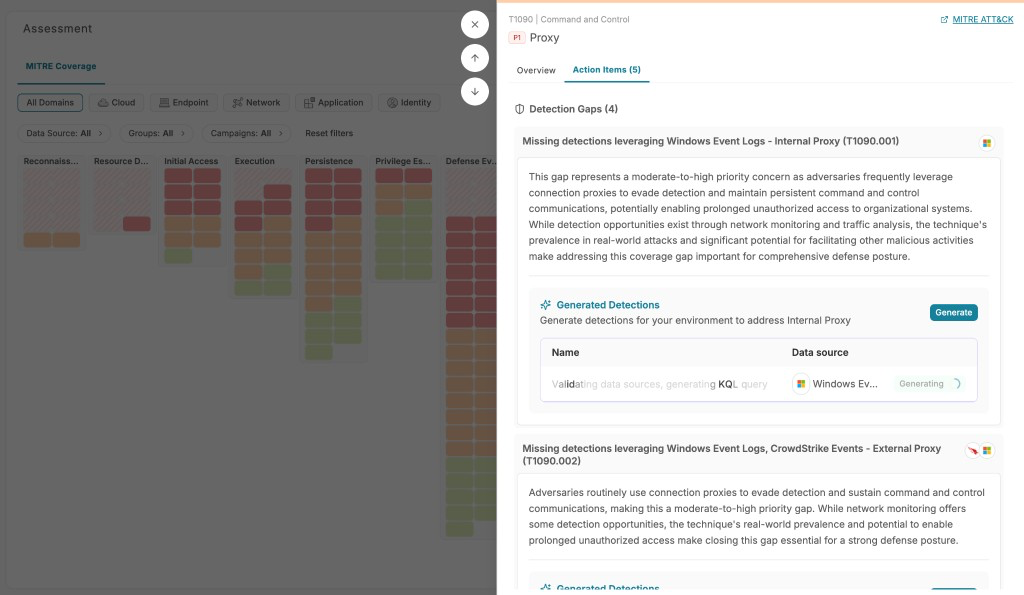
The tab surfaces two things:
- Detection Gaps. Sub-techniques where telemetry exists but no detection covers them, with adversary behavior context so you understand the risk before acting.
- Inactive Library Detections. Pre-built detections applicable to this technique, each showing historical matches so you can answer “is this going to be noisy?” before you commit.
From here, choose your path. Enable a library detection (immediately live, or in test mode first), or hit Generate to build a tailored detection when no library rule fits.
6. Understand what’s blocking you, and what data you’d need
Not every uncovered technique represents the same problem.
A technique is a blind spot only when two conditions are both true: no relevant data sources are connected, and no Vega library detections apply. If even one detection could run on existing telemetry, the technique is an actionable gap - you have a path forward today.
Blind spots are also a signal. They tell you exactly what data you’d need to onboard to start covering techniques you care about. If a threat actor you’re tracking heavily uses a tactic that’s fully blind in your environment, that’s a concrete data procurement conversation, not just an abstract gap. Actionable gaps need a detection. Blind spots need data first.
Key takeaways
- Your real posture, right now. No spreadsheets, no guesswork. Live telemetry and deployed detections, always current.
- Zoom in on what actually threatens you. Domain and threat-actor filters reshape the heatmap to your environment, not a generic framework.
- From gap spotted to detection deployed, without switching tabs. Enable from the library or generate one, right where you found the gap.
- Know if it’s noisy before you commit. Historical matches on every inactive detection, so the “enable” decision is informed, not a gamble.
- Know if you need a detection or need data. Blind spots tell you what to onboard. Actionable gaps tell you what to build.
What’s next
MITRE Coverage is available now on the Vega platform, evaluating your detection data in real time.
Want to see your real coverage? Book a demo or message your Vega account team.
And if you want to go deeper on why a federated analytics layer is what makes always-on coverage possible at all, our CPO Yonni’s piece on AI-native SecOps and the data layer underneath it is worth reading.


